In progress: Graphing Wikipedia page links
Previously I’ve created network graphs of low layer packet transmission between hardware addresses. Now I graph the network of HTML page linking. While numerous people have done this before, I have been unable to find satisfactorily large and beautiful examples. As a for-profit company, Google does not necessarily publish all their interesting results, and it is only recently that computers have become fast enough to render force-directed graphs of 100,000s of edges in reasonable time. I have written a golang web spider to scrape links, and R code to render graphs of the links.
I intend to eventually write a full description of my work; however, such a description will take some time to complete given my time constraints. Here I present the current state of my work.
Spider
- Simple web spider, written in golang.
- Supports arbitrarily ordered whitelists and blacklists for URL patterns.
- Supports recursive scraping to arbitrary depth.
- Uses boltdb for storage.
- Produces CSV edge list.
Code can be found here
Data stats
Because of the intensively inter-linked nature of most web pages, spidering all links to a depth of > 2 is prohibitively costly. However if one restricts the spider to a single domain, and aggressively blacklists administrative pages, one can spider with a depth of 3 or even greater.
I ran the spider starting from two Wikipedia page seed URLs, strictly limiting it to English Wikipedia articles. Including only edges both of whose nodes have been scraped gives the following edge counts.
| Seed URL | Depth | Edge count |
|---|---|---|
| http://en.wikipedia.org/wiki/Graph_theory | 2 | 12,124 |
| http://en.wikipedia.org/wiki/Graph_theory | 3 | 431,303 |
| http://en.wikipedia.org/wiki/Mouse | 2 | 9,127 |
| http://en.wikipedia.org/wiki/Mouse | 3 | 847,084 |
Rendering
When displaying such large numbers of edges, I am not interested in the connections individually, but only in the aggregate impression of how many edges exist between two communities of nodes. Therefore, I set edge width to <1 px so as to make visible only the clumps of lines that exist between communities of nodes, preventing the viewer from being distracted by individual edges.
Viewing
For labels to be of sufficient resolution to be readable, while still being small enough to not overlap, the graph must be rendered at extremely high resolution. For >10,000 edges, 2^14 pixels square is the minimum. (An even higher resolution render would be better; however at 2^15 power, cairo starts complaining.)
(2^14)^2 = 268,435,456 px
This produces PNG compressed images of ~250 MB.
Most image viewers have difficulty displaying such images. So far, feh is the only image viewer I have found capable of displaying images of such resolution. I am investigating other display methods, particularly web based dynamically tile loading viewers.
As these network graphs are almost never planar, a long-term ideal would be to lay out the graphs in 3D and view in VR. Also, squashing the numerous dimensions along which the nodes are distributed into three dimensions is less bad than squashing them into the two dimensions I am constrained to by the current igraph layout library.
Results
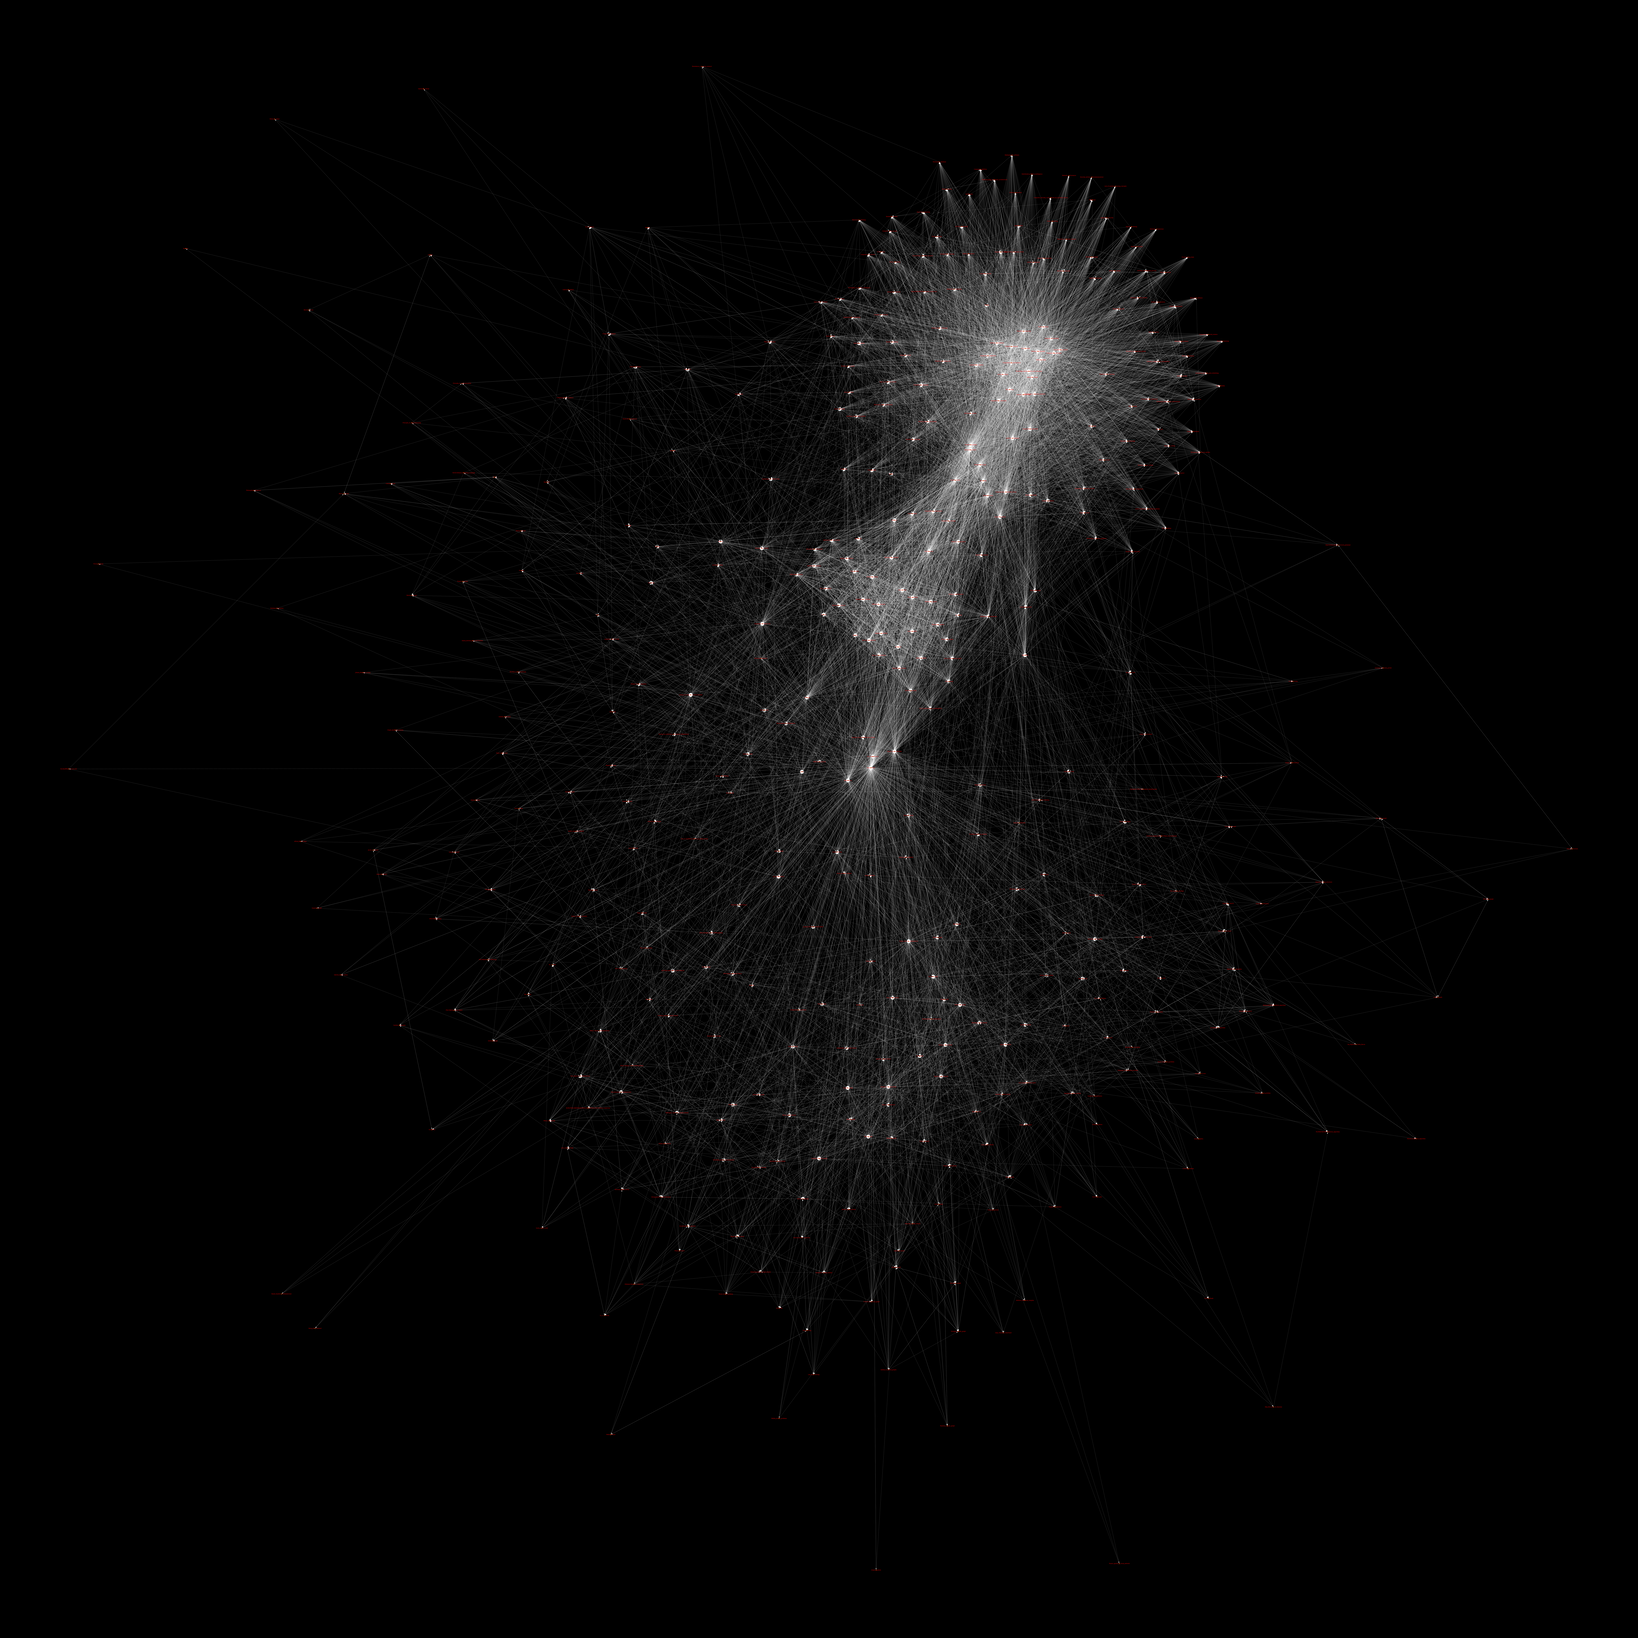
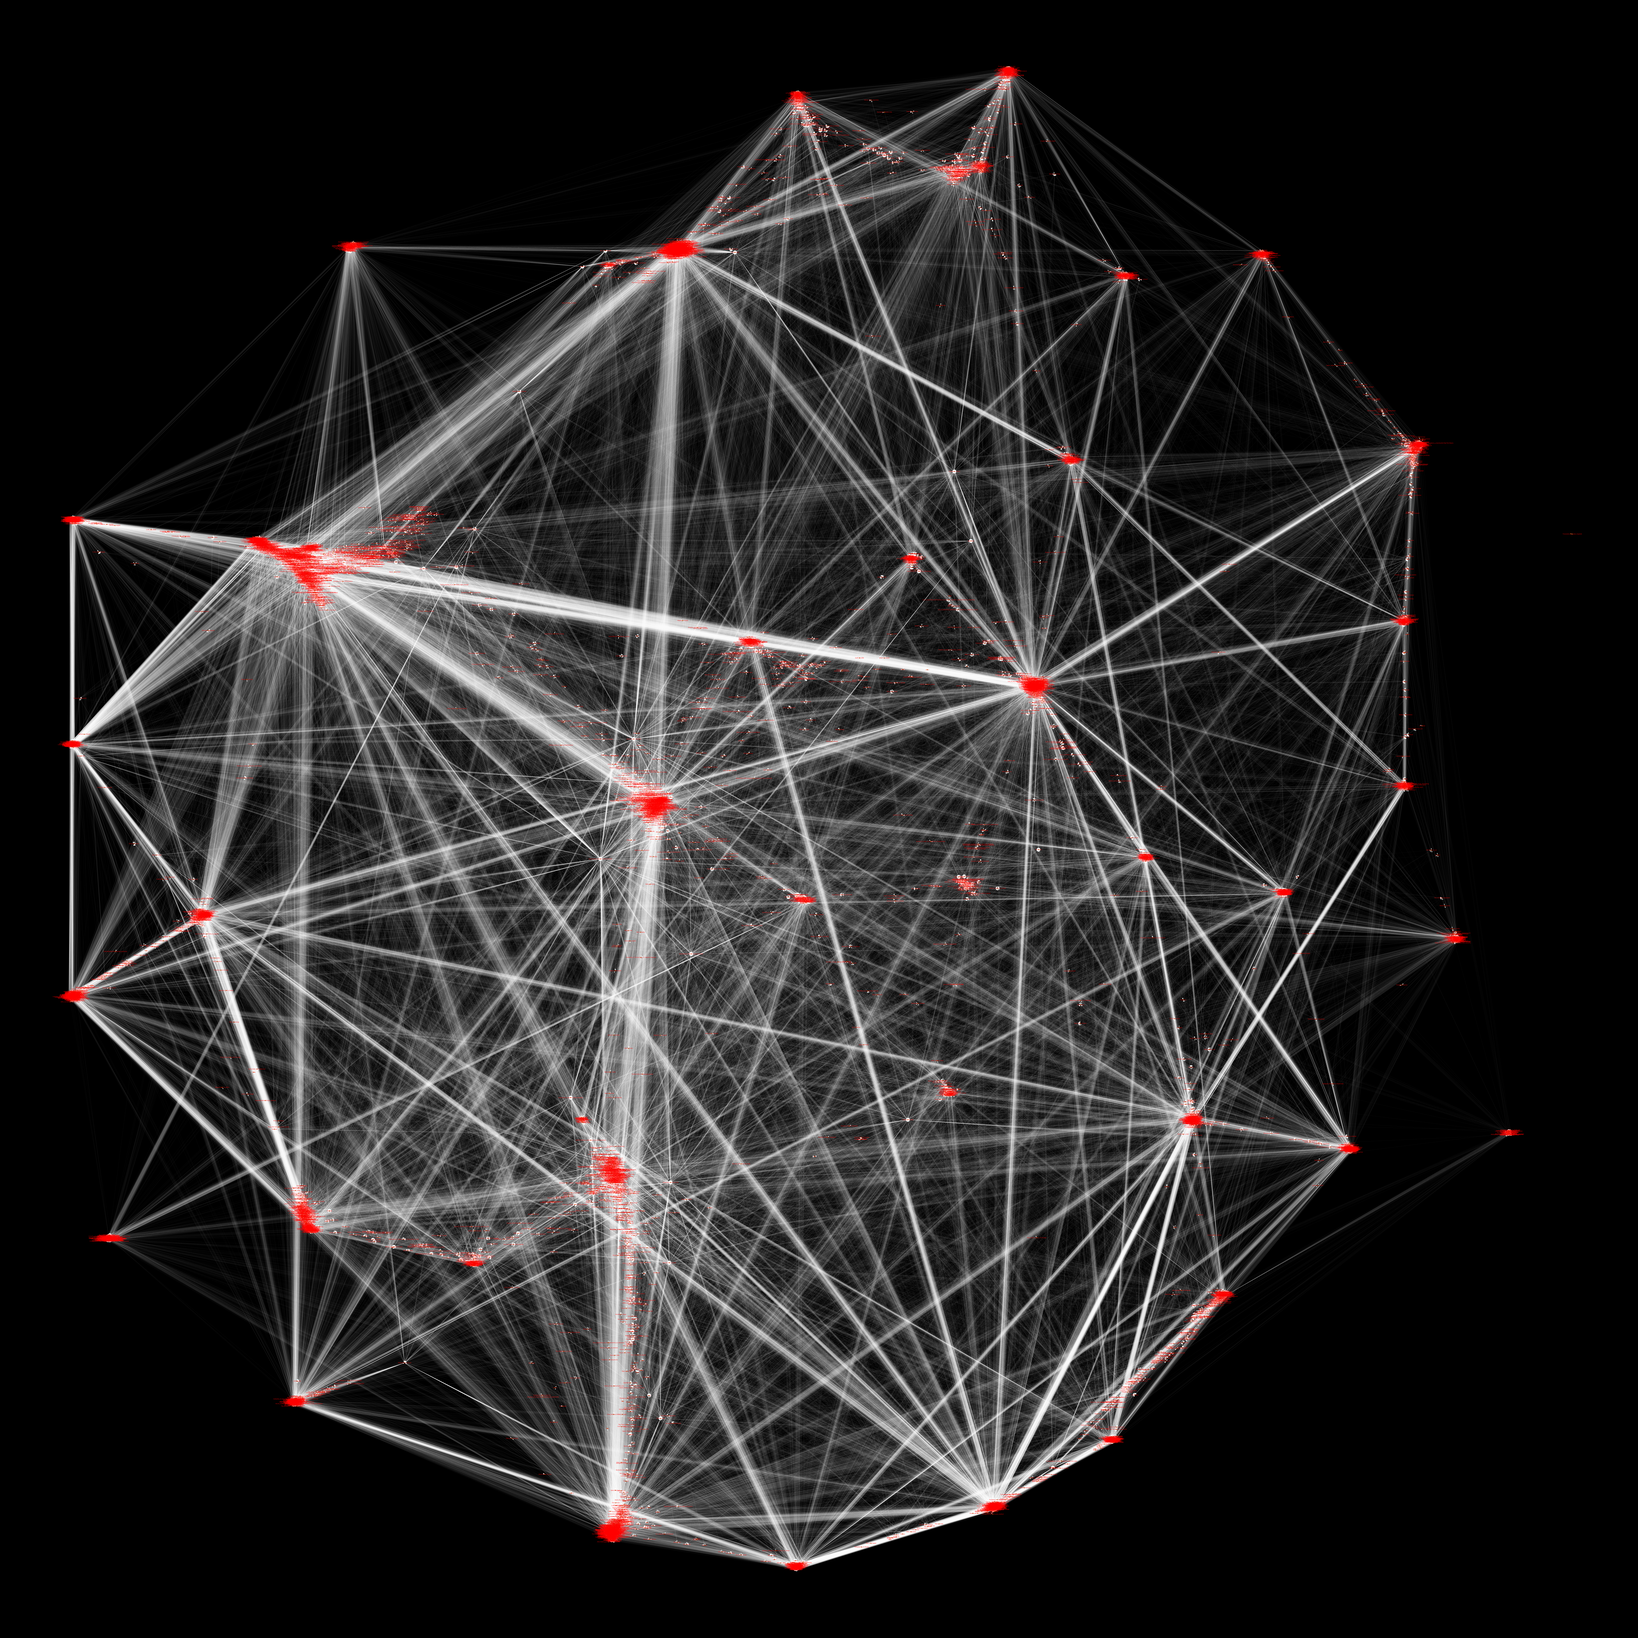
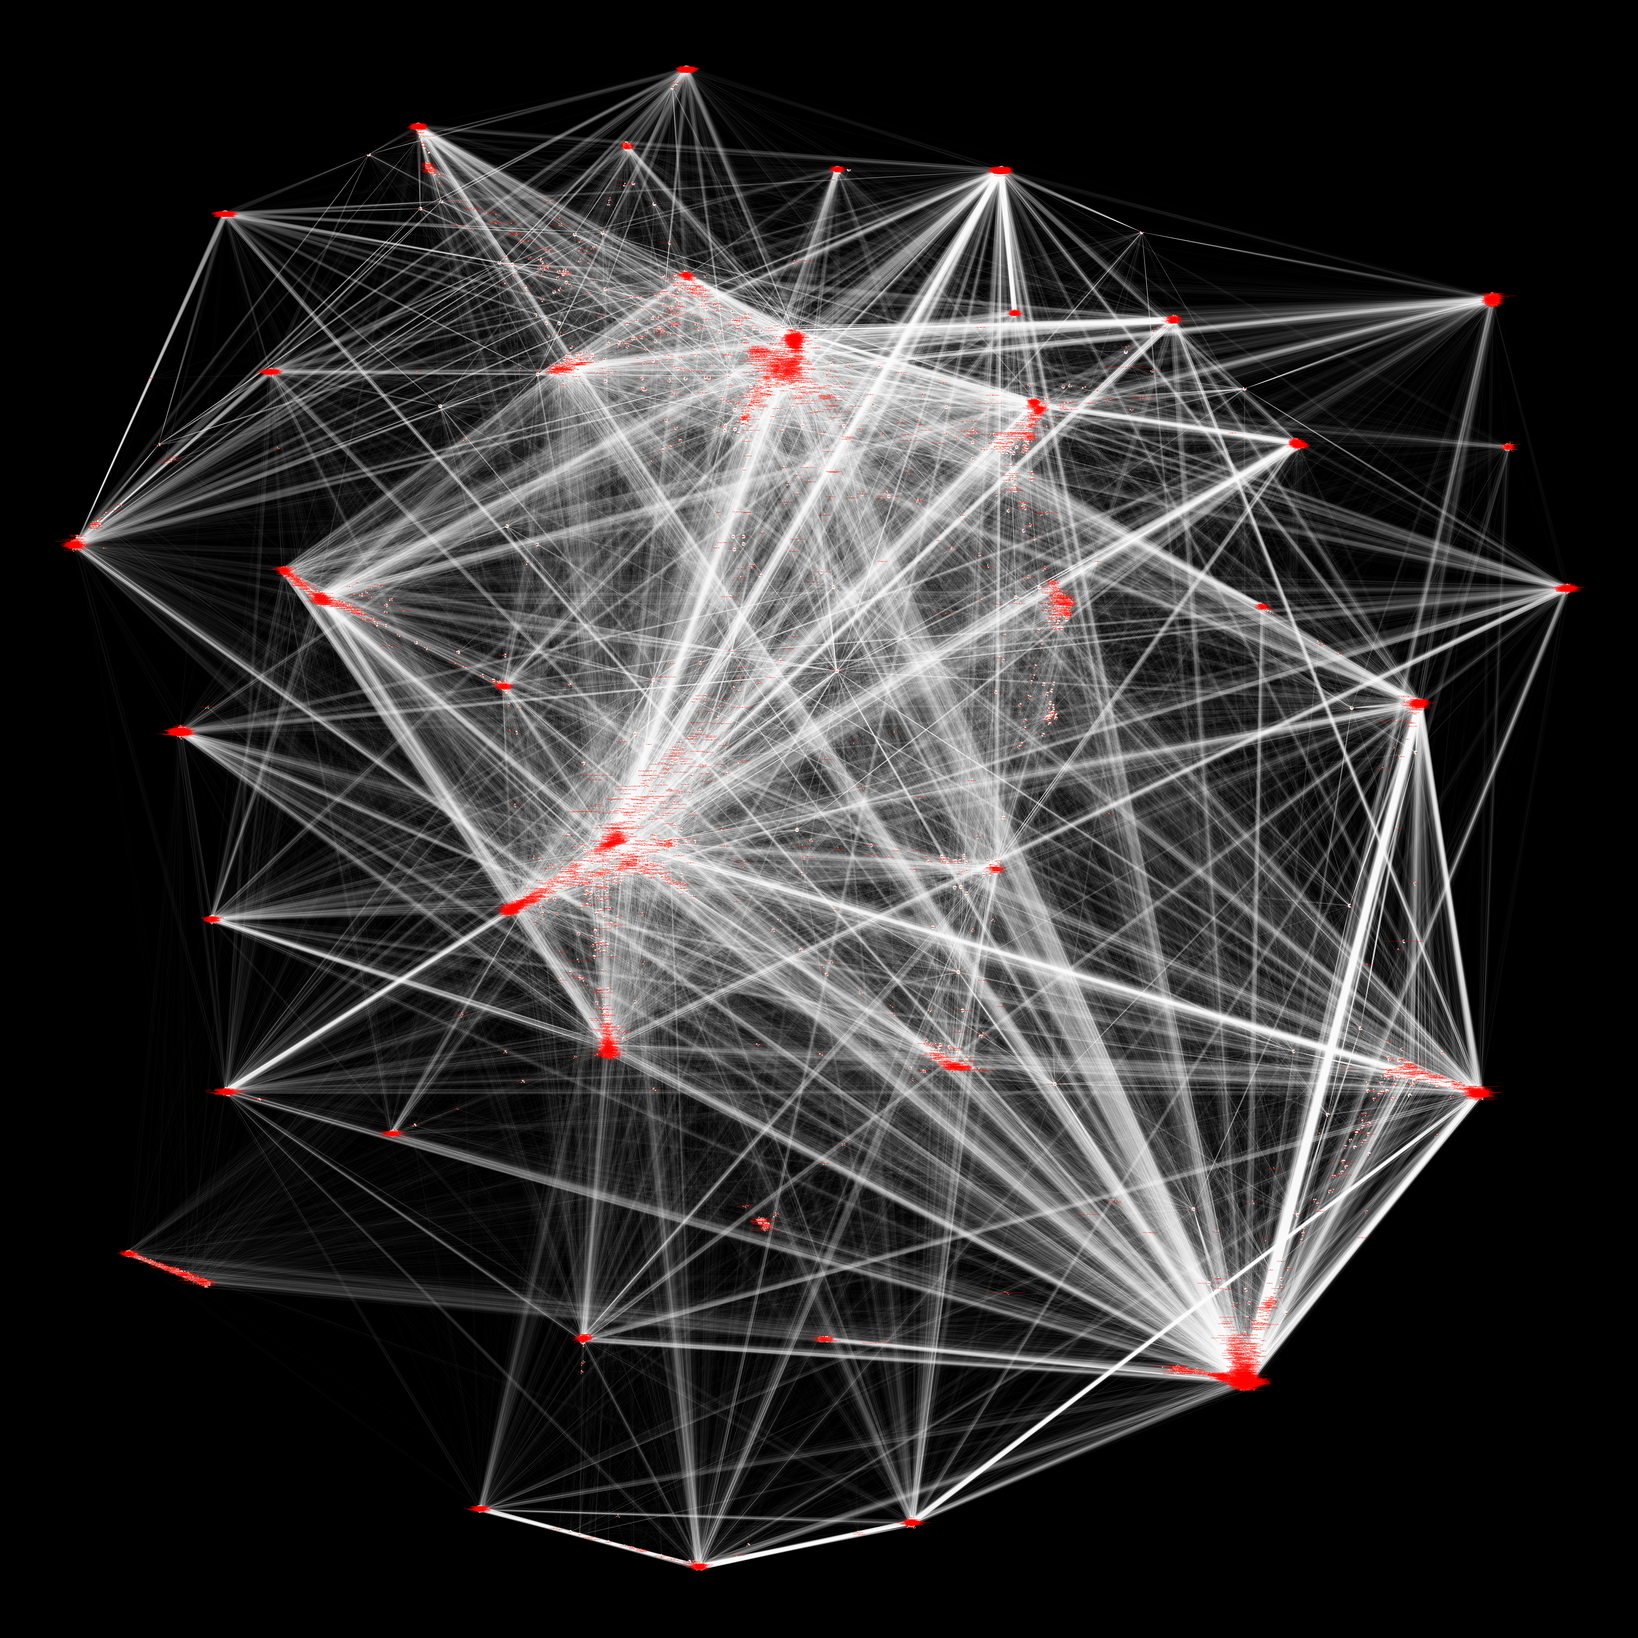
Below are shown rendered layouts of network graphs of all Wikipedia articles within n hops of the seed page.
White lines are edges.
Red smears are the labels on the nodes of a close-knit community (regrettably unreadable at the current resolution).
Depth of 2
At depth of 2 we see some nodes beginning to form into communities based on subject; however most are of roughly equal relatedness to all other nodes.
Pages within 2 hops of en.wikipedia.org/wiki/Graph_theory:
Pages within 2 hops of en.wikipedia.org/wiki/Mouse:
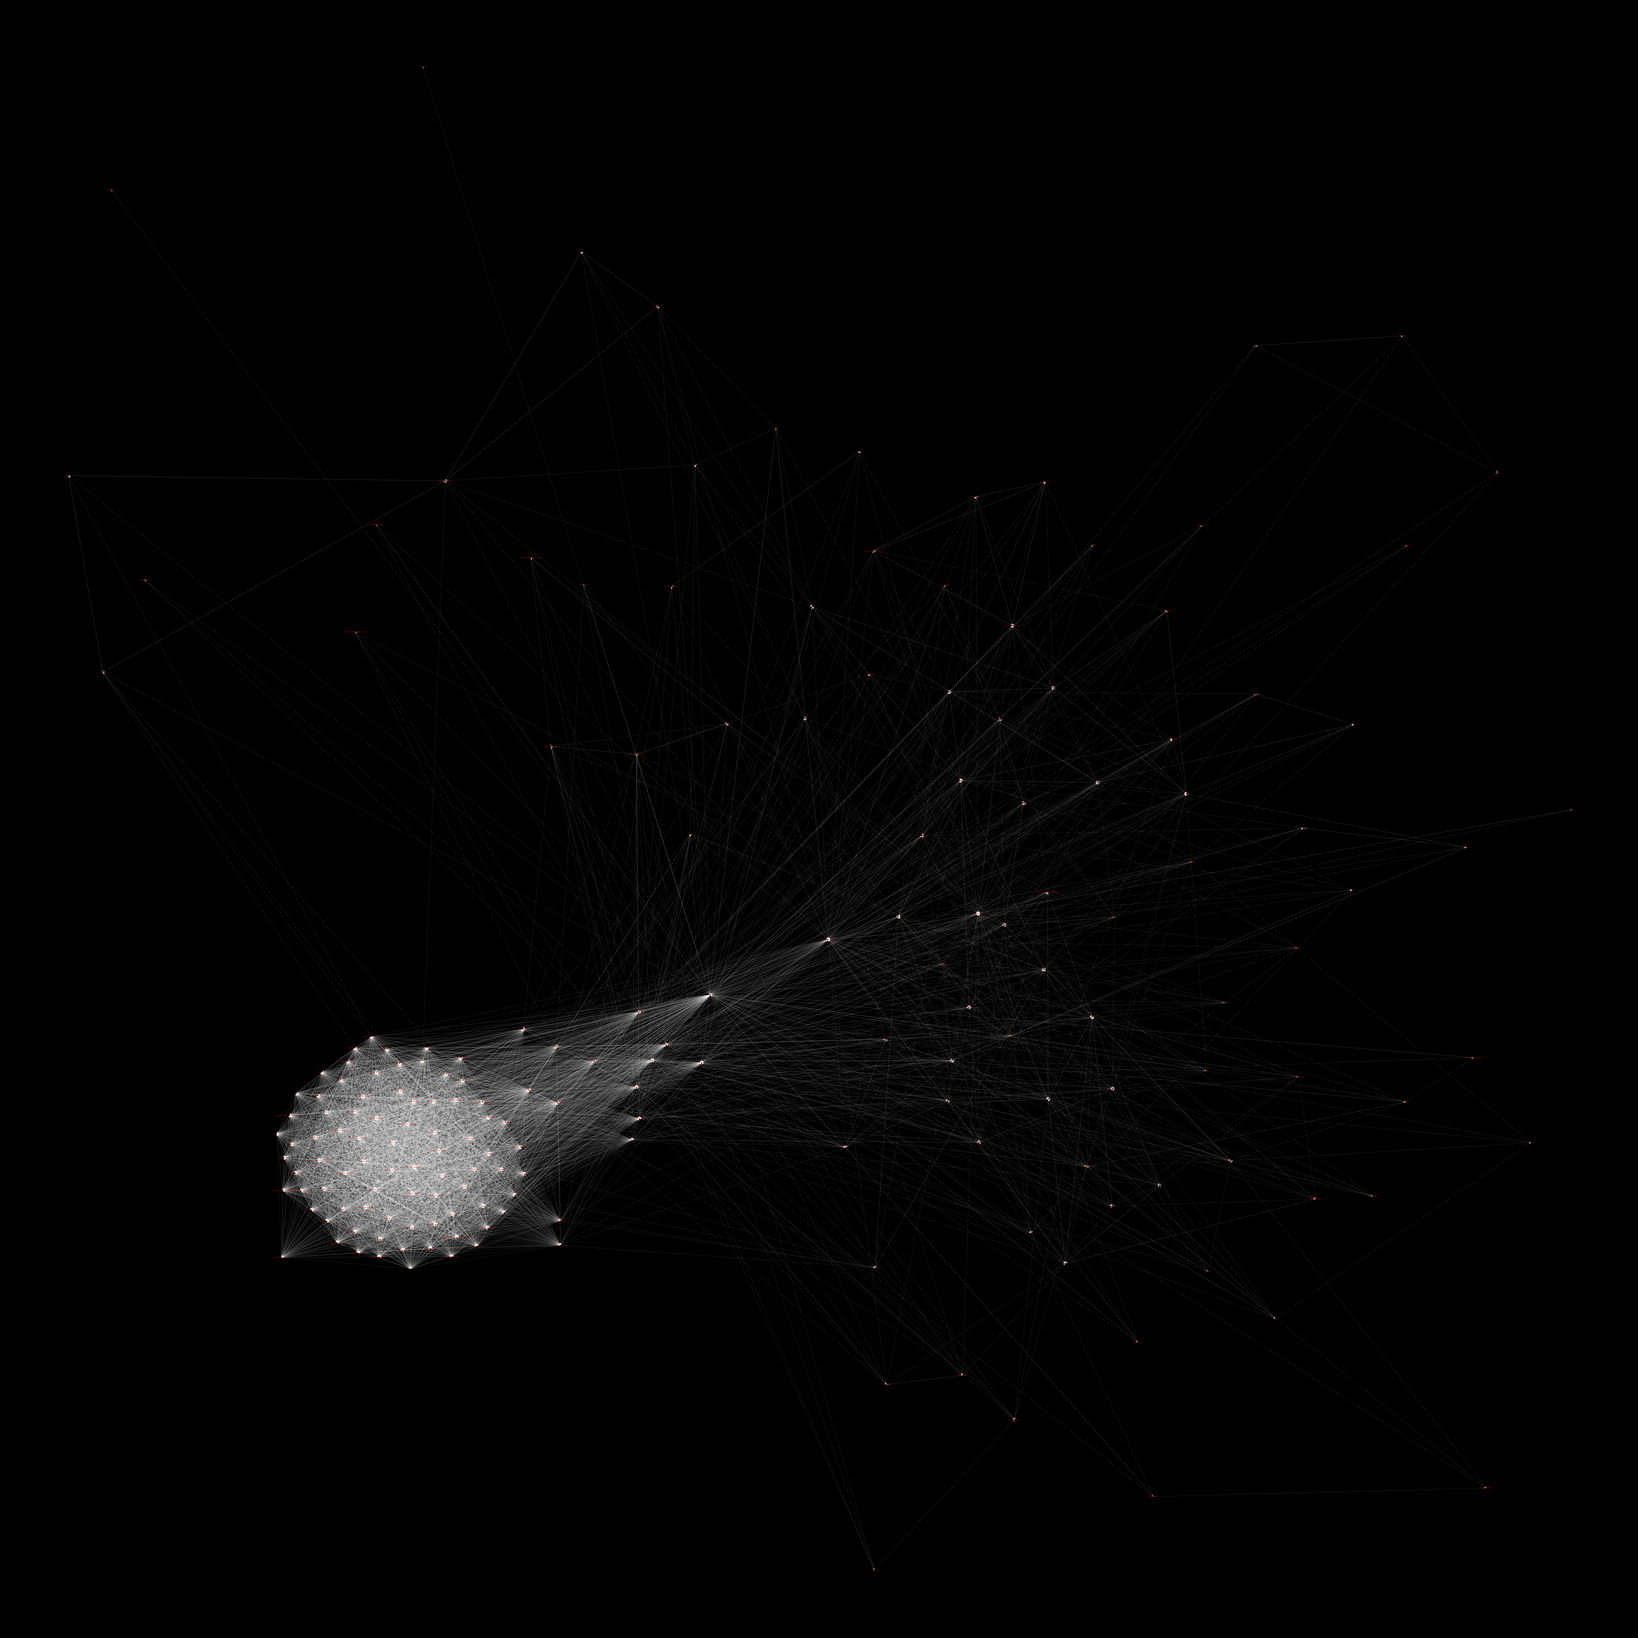
Depth of 3
At depth of 3, there are too many nodes for all nodes to be closely connected to all other nodes. Most nodes are closely related to a few other nodes, while being only distantly related to most others. Numerous compact subcultures form.
Pages within 3 hops of en.wikipedia.org/wiki/Graph_theory:
Pages within 3 hops of en.wikipedia.org/wiki/Mouse:
These four images were all rendered at 2^14 px square. However the graphs of depth 2 have edge width set to 0.5 px, while the graphs of depth 3 have edge width set to 0.1 px. This is necessary to compensate for the disparity in the number of edges.
Download
Original resolution 2^14 x 2^14 renders can be downloaded below. They are big files to download, and are far bigger when uncompressed by your image viewer.